
October 2, 2023
The Markets (as of market close September 29, 2023)
Stocks rebounded last Monday following the prior week's slump. Other than the Global Dow (-0.3%), each of the benchmark indexes listed here gained ground, led by the Nasdaq (0.5%), followed by the S&P 500 and the Russell 2000 (0.4%), and the Dow (0.1%). Energy, materials, and consumer discretionary led the sectors. Ten-year Treasury yields added 10.4 basis points to close at 4.54%, the highest level since 2007. Crude oil prices were flat, settling at about $89.95 per barrel. The dollar rose 0.4%, while gold prices fell 0.6%.
Wall Street couldn't maintain momentum from the day before as stocks tumbled last Tuesday. The Nasdaq slid 1.6%, the S&P 500 lost 1.5%, the Russell 2000 declined 1.3%, the Dow dipped 1.1%, and the Global Dow fell 1.0%. For perspective, the S&P 500 closed at its lowest level since early June, while the Dow had its largest single-day percentage decline since March. Ten-year Treasury yields, on the other hand, reached new highs after closing at 4.55%. Crude oil prices, which hovered around $90.59 per barrel, remain near 10-month highs. The stock market downturn extended to a fourth week, impacted by the continued hawkish Fed monetary policy, rising crude oil and gasoline prices, and stubborn inflation. September's decline in consumer confidence has not helped matters. And to add to investor angst, the Federal Government faced a potential shutdown, which was averted during the weekend…at least temporarily.
The Dow (-0.2%) and the Global Dow (-0.3%) slid lower last Wednesday, while the Russell 2000 (1.0%) and the Nasdaq (0.2%) advanced. The large caps of the S&P 500 ended the day where they began. Ten-year Treasury yields, pushed higher by sagging bond prices, added 6.8 basis points to close at 4.62%, the highest level since 2007. Crude oil prices jumped 3.6%, settling at $93.63 per barrel. The dollar rallied to its highest level in nearly a year, while gold prices dipped lower.
Stocks maintained momentum from the previous day, climbing higher last Thursday. Each of the benchmark indexes listed here posted gains, led by the Russell 2000 (0.9%), followed by the Nasdaq (0.8%), the S&P 500 (0.6%), and the Dow and the Global Dow (0.4%). Ten-year Treasury yields declined 2.9 basis points as bond prices inched higher. The 10-year Treasury yield settled at 4.59% on Thursday. Crude oil prices gave back some of last Wednesday's gains, falling 2.1% to $91.76 per barrel. The dollar and gold prices dipped lower.
Equities ended mostly lower last Friday, with a push from megacaps lifting the Nasdaq up 0.1%. The Russell 2000 and the Dow lost 0.5%, while the Global Dow and the S&P 500 slid 0.3%. Ten-year Treasury yields dipped 2.4 basis points to 4.57%. Crude oil prices fell nearly 1.0% to settle at $90.87 per barrel. The dollar and gold prices declined.
.png)
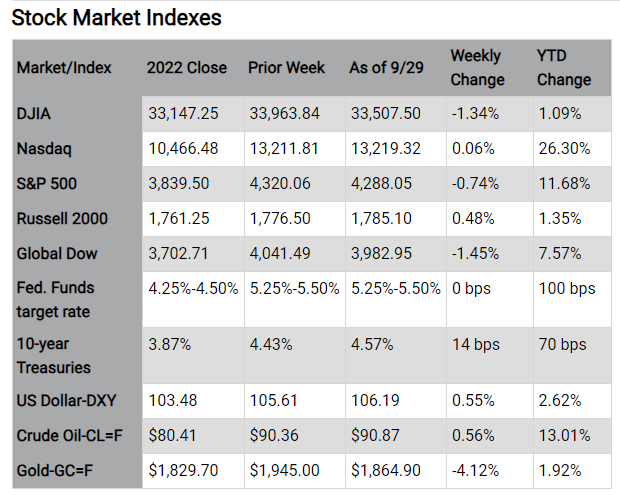
Chart reflects price changes, not total return. Because it does not include dividends or splits, it should not be used to benchmark the performance of specific investments.
Looking Ahead
The employment figures for September are out this week. The labor sector has been strong throughout the year, although the pace of new jobs added has slowed somewhat over the past few months. Hourly earnings continued to increase, rising 4.3% since August 2022.
Data sources: Economic: Based on data from U.S. Bureau of Labor Statistics (unemployment, inflation); U.S. Department of Commerce (GDP, corporate profits, retail sales, housing); S&P/Case-Shiller 20-City Composite Index (home prices); Institute for Supply Management (manufacturing/services). Performance: Based on data reported in WSJ Market Data Center (indexes); U.S. Treasury (Treasury yields); U.S. Energy Information Administration/Bloomberg.com Market Data (oil spot price, WTI, Cushing, OK); www.goldprice.org (spot gold/silver); Oanda/FX Street (currency exchange rates). News items are based on reports from multiple commonly available international news sources (i.e., wire services) and are independently verified when necessary with secondary sources such as government agencies, corporate press releases, or trade organizations. All information is based on sources deemed reliable, but no warranty or guarantee is made as to its accuracy or completeness. Neither the information nor any opinion expressed herein constitutes a solicitation for the purchase or sale of any securities, and should not be relied on as financial advice. Forecasts are based on current conditions, subject to change, and may not come to pass. U.S. Treasury securities are guaranteed by the federal government as to the timely payment of principal and interest. The principal value of Treasury securities and other bonds fluctuates with market conditions. Bonds are subject to inflation, interest-rate, and credit risks. As interest rates rise, bond prices typically fall. A bond sold or redeemed prior to maturity may be subject to loss. Past performance is no guarantee of future results. All investing involves risk, including the potential loss of principal, and there can be no guarantee that any investing strategy will be successful.
The Dow Jones Industrial Average (DJIA) is a price-weighted index composed of 30 widely traded blue-chip U.S. common stocks. The S&P 500 is a market-cap weighted index composed of the common stocks of 500 largest, publicly traded companies in leading industries of the U.S. economy. The NASDAQ Composite Index is a market-value weighted index of all common stocks listed on the NASDAQ stock exchange. The Russell 2000 is a market-cap weighted index composed of 2,000 U.S. small-cap common stocks. The Global Dow is an equally weighted index of 150 widely traded blue-chip common stocks worldwide. The U.S. Dollar Index is a geometrically weighted index of the value of the U.S. dollar relative to six foreign currencies. Market indexes listed are unmanaged and are not available for direct investment.
IMPORTANT DISCLOSURES Camden National Wealth Management does not provide investment, tax, legal, or retirement advice or recommendations. The information presented here is not specific to any individual's personal circumstances. To the extent that this material concerns tax matters, it is not intended or written to be used, and cannot be used, by a taxpayer for the purpose of avoiding penalties that may be imposed by law. Each taxpayer should seek independent advice from a tax professional based on his or her individual circumstances. These materials are provided for general information and educational purposes based upon publicly available information from sources believed to be reliable — we cannot assure the accuracy or completeness of these materials. The information in these materials may change at any time and without notice.
Trust and investment management services are provided by Camden National Bank, a national bank with fiduciary powers. Camden National Bank is a wholly owned subsidiary of Camden National Corporation. Camden National Bank does not provide tax, accounting or legal advice. Please consult your accountant and/or attorney for tax and legal advice.
Investment solutions such as stocks, bonds and mutual funds are:
"NOT A DEPOSIT • NOT FDIC INSURED • NOT GUARANTEED BY THE BANK • NOT INSURED BY ANY FEDERAL GOVERNMENT AGENCY • MAY LOSE VALUE"