
March 4, 2026
The Markets (as of market close February 27, 2026)
The U.S. stock market ended the month on a rather sour note, with both the S&P 500 and the NASDAQ closing February in the red, while the Dow managed to just edge into the black. After a strong start in January, the tech rally cooled, as investors grew concerned about market concentration. Tech stocks tumbled, while defensive and cyclical stocks trended higher. Mega-cap stocks, which carried the market throughout 2025, saw increased volatility in 2026. Investors questioned big-tech valuations, seizing an opportunity to take profits. In February, money moved to value stocks, such as energy, materials, and consumer staples.
While January was a strong month for the U.S. economy, February presented a more complex picture. The labor market stabilized somewhat, while new trade policies and fiscal shifts created volatility in the markets. Gross domestic product appears to be in a recovery phase following last year's government shutdown. Economic growth slowed from 4.4% in the third quarter of 2025 to 1.4% in the fourth quarter. Consumer spending grew by 2.4% in the fourth quarter vs. an expansion of 3.5% in the previous quarter and 3.9% from a year earlier.
Price pressures continued to moderate but remained above the Federal Reserve's 2.0% target, impacted by tariffs, both threatened and realized, and overall fiscal policy uncertainty. The personal consumption expenditures (PCE) price index, a preferred measure of inflation by the Federal Reserve, rose 0.4% in December (+0.2% in November) and 2.9% from December 2024 (+2.8% for the 12 months ended in November 2025).
The labor market continued to show signs of moderate strengthening. Job growth, which had slowed considerably, rose from 48,000 in December to 130,000 in January. The unemployment rate ticked down 0.1 percentage point to 4.4% in January but was above the rate from a year earlier.
The Federal Reserve did not meet in February but held interest rates steady in January. While inflation slowly drew nearer to its 2.0% target, the Fed's stance suggests they are waiting to see how new trade policies impact price stability before considering further cuts.
Among the market sectors, energy, utilities, consumer staples, and industrials led the way, while consumer discretionary and information technology each fell more than 7.0%.
According to FactSet, fourth-quarter corporate earnings yielded solid results even as market valuations remain high. The earnings growth rate for the fourth quarter was 13.2%, which marked the fifth straight quarter of double-digit earnings growth. Corporate revenue growth, at 9.0%, was the highest since the third quarter of 2022. More specifically, 74% of S&P 500 companies reported earnings per share above estimates (slightly below the five-year average of 78%), while 73% have exceeded revenue estimates (above the five-year average of 70%).
U.S. Treasuries began the month with yields trending higher due to sticky inflation and a resilient economy. However, the end of the month saw yields plunge to multi-month lows. The benchmark 10-year Treasury yield, which heavily influences mortgage and corporate borrowing rates, experienced a volatile month, ultimately tumbling under 4.0%. The yield on two-year Treasuries fell about 12 basis points to 3.4%.
Crude oil prices also experienced volatility in February, largely impacted by escalating geopolitical risks against weakening global demand. While prices surged to a six-month high mid-month due to tensions in the Middle East, a growing global supply surplus pushed prices lower. The retail price of regular gasoline was $2.937 per gallon on February 23, $0.084 above the price a month earlier but $0.188 lower than the price a year ago. The dollar experienced a shift in momentum, with February marking the first monthly gain since October 2025. Gold prices rebounded from a notable crash at the end of January, ultimately regaining momentum to close above the $5,000 mark.
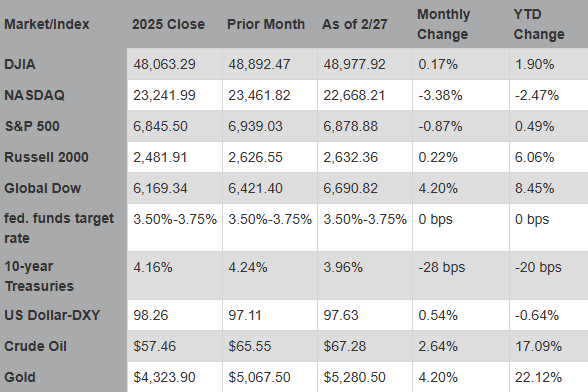
Chart reflects price changes, not total return. Because it does not include dividends or splits, it should not be used to benchmark the performance of specific investments.
Eye on the Month Ahead
While investors move into March looking for economic improvement and a slowdown in price pressures, the recent escalation of geopolitical tensions in the Middle East will likely increase short-term uncertainty.
Data sources: Economic: Based on data from U.S. Bureau of Labor Statistics (unemployment, inflation); U.S. Department of Commerce (GDP, corporate profits, retail sales, housing); S&P/Case-Shiller 20-City Composite Index (home prices); Institute for Supply Management (manufacturing/services). Performance: Based on data reported in WSJ Market Data Center (indexes); U.S. Treasury (Treasury yields); U.S. Energy Information Administration/Bloomberg.com Market Data (oil spot price, WTI, Cushing, OK); www.goldprice.org (spot gold/silver); Oanda/FX Street (currency exchange rates). News items are based on reports from multiple commonly available international news sources (i.e., wire services) and are independently verified when necessary with secondary sources such as government agencies, corporate press releases, or trade organizations. All information is based on sources deemed reliable, but no warranty or guarantee is made as to its accuracy or completeness. Neither the information nor any opinion expressed herein constitutes a solicitation for the purchase or sale of any securities, and should not be relied on as financial advice. Forecasts are based on current conditions, subject to change, and may not come to pass. U.S. Treasury securities are guaranteed by the federal government as to the timely payment of principal and interest. The principal value of Treasury securities and other bonds fluctuates with market conditions. Bonds are subject to inflation, interest-rate, and credit risks. As interest rates rise, bond prices typically fall. A bond sold or redeemed prior to maturity may be subject to loss. Past performance is no guarantee of future results. All investing involves risk, including the potential loss of principal, and there can be no guarantee that any investing strategy will be successful.
IMPORTANT DISCLOSURES Camden National Wealth Management does not provide investment, tax, legal, or retirement advice or recommendations. The information presented here is not specific to any individual's personal circumstances. To the extent that this material concerns tax matters, it is not intended or written to be used, and cannot be used, by a taxpayer for the purpose of avoiding penalties that may be imposed by law. Each taxpayer should seek independent advice from a tax professional based on his or her individual circumstances. These materials are provided for general information and educational purposes based upon publicly available information from sources believed to be reliable — we cannot assure the accuracy or completeness of these materials. The information in these materials may change at any time and without notice.
Trust and investment management services are provided by Camden National Bank, a national bank with fiduciary powers. Camden National Bank is a wholly owned subsidiary of Camden National Corporation. Camden National Bank does not provide tax, accounting or legal advice. Please consult your accountant and/or attorney for tax and legal advice.
Investment solutions such as stocks, bonds and mutual funds are:
"NOT A DEPOSIT • NOT FDIC INSURED • NOT GUARANTEED BY THE BANK • NOT INSURED BY ANY FEDERAL GOVERNMENT AGENCY • MAY LOSE VALUE"