
June 1, 2026
The Markets (as of market close May 29, 2026)
The U.S. stock market continued its April momentum through May. Each of the benchmark indexes listed here posted notable monthly gains, with several indexes reaching historic highs. The May rally was largely dominated by the information technology sector, particularly AI shares. An exceptional Q1 corporate earnings performance helped support Wall Street's May surge. The S&P 500 and the NASDAQ each set new records in May, and while the Dow lagged somewhat behind those benchmarks, it nonetheless rose well past the 50,000 threshold. However, while headlines throughout May focused on stocks at record highs, the broader economy showed signs of stagflation.
Wall Street's rally in May was driven by tech and AI stocks, which heavily dominated the market share of gains. Health care and consumer discretionary shares also helped drive the overall market, which saw gains in communication services, industrials, and real estate. Utilities, energy, consumer staples, financials, and materials lagged.
While equities soared, the bond market exhibited anxiety over inflation and fiscal sustainability. The yield on 10-year Treasuries hovered around 4.30%-4.60% for most of the month, with yields reaching their highest levels since July 2025, evidencing a broad repricing on inflationary pressures, elevated energy prices, and uncertainty surrounding Federal Reserve leadership and policy direction. Yields on two-year notes hovered around 4.00% as markets soured on potential interest rate cuts for the remainder of 2026.
Price pressures accelerated in May. Both the personal consumption expenditures (PCE) price index (the preferred inflation indicator of the Federal Reserve) and the Consumer Price Index rose 3.8% since last April, well above the Federal Reserve's 2.0% target. Prices at the wholesale level increased by 6.0% over the past 12 months, their fastest pace of growth since 2022.
In addition to price pressures, the economy showed signs of slowing. First-quarter gross domestic product was revised downward to an annualized rate of 1.6% from an earlier estimate of 2.0%. While business and government spending provided some cushion, consumer spending decelerated from 1.9% to 1.4%. Slowing wage growth and higher fuel costs helped weaken consumer spending and disposable income, which fell to its lowest level since February 2025.
The labor market continued to show signs of moderate strengthening. Overall, the labor market presented a picture of stability, with signs of moderation, marked by steady unemployment and modest job gains. The Federal Reserve noted that the labor market remained stable but slower than in prior years.
Corporate earnings in Q1 showed very strong performance from S&P 500 companies, marking the fastest earnings growth since 2021, with gains spreading across several sectors. Earnings growth surged to 28.4% year over year according to FactSet, with 84% of S&P 500 companies beating earnings per share (EPS) estimates. All of the "Magnificent 7" companies beat EPS expectations, with their earnings exceeding estimates by 32.5%, roughly twice the S&P 500 average.
Crude oil prices experienced a sharp reversal in May, with prices falling over 16.5% as geopolitical uncertainty eased due to expectations of a U.S.-Iran ceasefire and improving prospects for the reopening of the Strait of Hormuz. The retail price of regular gasoline was $4.475 per gallon on May 25, $0.352 above the price a month earlier and $1.315 higher than the price a year ago. The dollar showed resilience in May, closing the month at about where it began, despite a myriad of domestic economic factors, including a slowing labor market and persistent inflationary pressures.
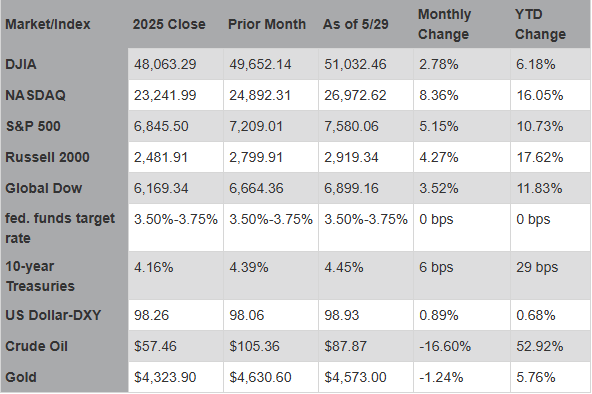
Chart reflects price changes, not total return. Because it does not include dividends or splits, it should not be used to benchmark the performance of specific investments.
Eye on the Month Ahead
Most of the attention in June will be focused on the employment and inflation data for May. The Federal Open Market Committee, with new Chair Kevin Warsh, meets in June for the first time since April.
Data sources: Economic: Based on data from U.S. Bureau of Labor Statistics (unemployment, inflation); U.S. Department of Commerce (GDP, corporate profits, retail sales, housing); S&P/Case-Shiller 20-City Composite Index (home prices); Institute for Supply Management (manufacturing/services). Performance: Based on data reported in WSJ Market Data Center (indexes); U.S. Treasury (Treasury yields); U.S. Energy Information Administration/Bloomberg.com Market Data (oil spot price, WTI, Cushing, OK); www.goldprice.org (spot gold/silver); Oanda/FX Street (currency exchange rates). News items are based on reports from multiple commonly available international news sources (i.e., wire services) and are independently verified when necessary with secondary sources such as government agencies, corporate press releases, or trade organizations. All information is based on sources deemed reliable, but no warranty or guarantee is made as to its accuracy or completeness. Neither the information nor any opinion expressed herein constitutes a solicitation for the purchase or sale of any securities, and should not be relied on as financial advice. Forecasts are based on current conditions, subject to change, and may not come to pass. U.S. Treasury securities are guaranteed by the federal government as to the timely payment of principal and interest. The principal value of Treasury securities and other bonds fluctuates with market conditions. Bonds are subject to inflation, interest-rate, and credit risks. As interest rates rise, bond prices typically fall. A bond sold or redeemed prior to maturity may be subject to loss. Past performance is no guarantee of future results. All investing involves risk, including the potential loss of principal, and there can be no guarantee that any investing strategy will be successful.
IMPORTANT DISCLOSURES Camden National Wealth Management does not provide investment, tax, legal, or retirement advice or recommendations. The information presented here is not specific to any individual's personal circumstances. To the extent that this material concerns tax matters, it is not intended or written to be used, and cannot be used, by a taxpayer for the purpose of avoiding penalties that may be imposed by law. Each taxpayer should seek independent advice from a tax professional based on his or her individual circumstances. These materials are provided for general information and educational purposes based upon publicly available information from sources believed to be reliable — we cannot assure the accuracy or completeness of these materials. The information in these materials may change at any time and without notice.
Trust and investment management services are provided by Camden National Bank, a national bank with fiduciary powers. Camden National Bank is a wholly owned subsidiary of Camden National Corporation. Camden National Bank does not provide tax, accounting or legal advice. Please consult your accountant and/or attorney for tax and legal advice.
Investment solutions such as stocks, bonds and mutual funds are:
"NOT A DEPOSIT • NOT FDIC INSURED • NOT GUARANTEED BY THE BANK • NOT INSURED BY ANY FEDERAL GOVERNMENT AGENCY • MAY LOSE VALUE"