
August 2, 2023
The Markets (as of market close July 31, 2023)
The Federal Reserve, in its endeavor to bring inflation down to the government's 2.0% target, hiked interest rates another 25.0 basis points in July, to the highest level in 22 years (see below). However, there are clear signs that inflation is finally receding. The Consumer Price Index and the personal consumption expenditures price index saw their respective 12-month rates fall to the lowest levels in nearly two years. Import and export prices dipped lower in July, as did producer prices.
The battle to reign in rising prices has also been waged throughout much of the world. While several countries in Europe and Canada have seen inflationary pressures begin to slide, they remain above preferred target rates.
Consumer spending, the bellwether of economic growth, continued to increase, although not quite at the pace set earlier in the year. The same can be said for gross domestic product, which accelerated in the second quarter and has continued to advance since the second quarter of 2022.
Employment also remained strong, with more than 200,000 new jobs added, while the unemployment rate sat at 3.6%. Wages continued to rise, however, increasing nearly 4.5% over the last 12 months. Unemployment claims are up from a year ago (see below) but remain well under the ballooning figures seen during the height of the COVID pandemic.
While many economic indicators showed strength last month, several sectors retreated. The housing market has retreated, primarily due to lack of inventory and advancing mortgage rates. Sales of new and existing homes floundered, although home prices remained strong.
Industrial production declined (see below), having fallen for two straight months. According to the latest survey from the S&P Global US Manufacturing Purchasing Managers' Index™, purchasing managers also noted a retraction in manufacturing.
While the economy remained relatively strong, the stock market proved equally robust. The S&P 500 and the Nasdaq enjoyed five straight months of gains, closing out their best seven-month stretch to start the year since 1997. Year to date, the Nasdaq is up more than 37.0%, while the S&P 500 exceeded 19.0%. In July, the Dow saw a run of 13 consecutive sessions with gains.
Last month, all of the market sectors advanced. Some notable performers included energy (8.0%), communication services (7.8%), financials (5.7%), and materials (4.0%). Information technology rose 4.5%, driven higher by rising artificial intelligence stocks.
Bond prices fell lower in July, with yields increasing over the previous month. Ten-year Treasury yields rose 14.0 basis points from June. The 2-year Treasury yield ended July at 4.85%, down 7.0 basis points from a month earlier. The dollar dipped lower against a basket of world currencies. Gold prices ended July higher. Crude oil prices climbed in July for the second straight month. After falling for much of the year, a cutback in crude oil production has driven prices higher. Rising oil prices also impacted prices at the pump. The retail price of regular gasoline was $3.596 per gallon on July 24, $0.025 higher than the price a month earlier but $0.734 lower than a year ago.
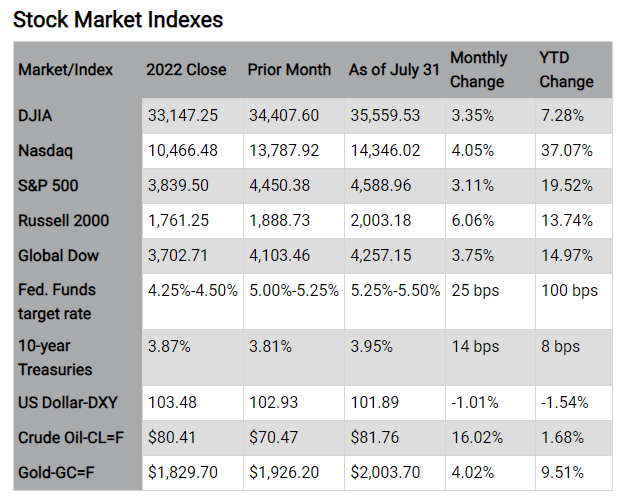
Chart reflects price changes, not total return. Because it does not include dividends or splits, it should not be used to benchmark the performance of specific investments.
Looking Ahead
Investors will focus on corporate earnings and the labor market in August. The Federal Open Market Committee does not meet in August, so there will be no change to the Federal Funds target rate. Manufacturing, which has slowed during the summer months, looks to pick up steam in August.
The Dow Jones Industrial Average (DJIA) is a price-weighted index composed of 30 widely traded blue-chip U.S. common stocks. The S&P 500 is a market-cap weighted index composed of the common stocks of 500 largest, publicly traded companies in leading industries of the U.S. economy. The NASDAQ Composite Index is a market-value weighted index of all common stocks listed on the NASDAQ stock exchange. The Russell 2000 is a market-cap weighted index composed of 2,000 U.S. small-cap common stocks. The Global Dow is an equally weighted index of 150 widely traded blue-chip common stocks worldwide. The U.S. Dollar Index is a geometrically weighted index of the value of the U.S. dollar relative to six foreign currencies. Market indexes listed are unmanaged and are not available for direct investment.
IMPORTANT DISCLOSURES Camden National Wealth Management does not provide investment, tax, legal, or retirement advice or recommendations. The information presented here is not specific to any individual's personal circumstances. To the extent that this material concerns tax matters, it is not intended or written to be used, and cannot be used, by a taxpayer for the purpose of avoiding penalties that may be imposed by law. Each taxpayer should seek independent advice from a tax professional based on his or her individual circumstances. These materials are provided for general information and educational purposes based upon publicly available information from sources believed to be reliable — we cannot assure the accuracy or completeness of these materials. The information in these materials may change at any time and without notice.
Trust and investment management services are provided by Camden National Bank, a national bank with fiduciary powers. Camden National Bank is a wholly owned subsidiary of Camden National Corporation. Camden National Bank does not provide tax, accounting or legal advice. Please consult your accountant and/or attorney for tax and legal advice.
Investment solutions such as stocks, bonds and mutual funds are:
"NOT A DEPOSIT • NOT FDIC INSURED • NOT GUARANTEED BY THE BANK • NOT INSURED BY ANY FEDERAL GOVERNMENT AGENCY • MAY LOSE VALUE"