
April 2, 2026
The Markets (first quarter through March 31, 2026)
The first quarter of 2026 saw a shift in market preference. After years of index performance dominated by a handful of tech giants and AI companies, investor preference moved toward value, small caps, and real economy sectors. The three major U.S. indexes, the Dow, the S&P 500, and the NASDAQ, each declined by the end of March. Conversely, the Russell 2000's relative resilience and the strong performance of energy and defensive sectors underscored the investor preference shift. Energy, utilities, and consumer staples outperformed, replacing consumer discretionary, information technology, and communication services. The energy surge was driven by a sharp spike in oil prices following the escalating conflict involving Iran, including disruptions in the Strait of Hormuz, which accounts for 20%-30% of global crude flows. The primary drivers of the stock market in the first quarter were an escalation of Middle East tensions, sustained triple-digit oil prices, and a sharper-than-expected deterioration in the labor market.
The U.S. bond market was relatively stable in the first quarter. As the Federal Reserve maintained a cautious stance during a period of rising inflation and geopolitical unrest, the bond market was influenced by economic growth, a steepening yield curve, and a shift in stock market focus. The U.S. Treasury market experienced significant volatility and a notable steepening of the yield curve. Ten-year Treasuries hovered around 4.16% at the start of the year, rising to 4.30% by the end of March. The two-year note remained in the 3.4%-3.6% range for the quarter. The yield curve, which had been inverted for much of the previous two years, began to move back toward positive territory.
Despite a backdrop of geopolitical volatility and sticky inflation, U.S. corporations showed resilience and broadening growth. FactSet projects double-digit earnings growth for the sixth straight quarter. So far in the first quarter, 60 S&P 500 companies have issued positive earnings per share (EPS) projections, compared to 50 companies reporting negative guidance. This ratio is significantly better than the five and 10-year averages. In spite of a drop in stock market share, information technology and communication services sectors were the primary engines of growth, with the IT sector projected to see a nearly 41% price increase, while the energy sector has seen some of the largest upward revisions in EPS.
The first quarter saw gold prices deliver one of the most volatile and consequential periods in years. After surging to historic highs at the beginning of the year, gold prices fell dramatically mid-quarter before leveling off at the end of March. Ultimately, gold prices ended the quarter well below their January peak but still elevated relative to 2025 year-end values.
Crude oil prices entered 2026 on relatively stable footing, only to experience one of the most turbulent quarters in history, driven by dramatic conflict in the Middle East and shifting supply sources. Crude oil prices began the year at around $57.50 per barrel, driven lower by abundant supply. However, the oil market's entire trajectory changed when the conflict in Iran escalated sharply, which resulted in the blockade of the Strait of Hormuz, a major passageway for the shipment of crude oil. This event effectively flipped the market from oversupply to suddenly fragile, vaulting prices up in February and March to well over $100.00 per barrel. The retail price for regular gasoline was $3.990 per gallon on March 30, $1.053 above the price at the end of February and $0.828 more than the price a year ago. According to Freddie Mac, the 30-year fixed-rate mortgage averaged 6.38% as of March 26. That's down from 6.65% one year ago.
From an economic perspective, the first quarter of 2026 may best be defined as a tug-of-war between slow but steady economic stimulus and the energy shock from the conflict in the Middle East. Gross domestic product (GDP) slowed in the fourth quarter of 2025, rising at a rate of 0.7% versus 4.4% in the third quarter. The Philadelphia Fed's Survey of Professional Forecasters in March projected the economy to expand at an annual rate of 2.6% in the first quarter of 2026. Consumer spending, the major component of GDP, remained resilient despite sticky inflation, credit costs, and labor market uncertainty. The labor market continued to cool following a slowdown at the close of 2025. Job growth increased in January from the previous month, only to drop precipitously in February, while the unemployment rate remained in the 4.3%-4.4% range.
Inflationary pressures stabilized somewhat in the first quarter but remained above the Fed's target of 2.0%. The personal consumption expenditures (PCE) price index showed a 12-month price increase of 2.8%, while the Consumer Price Index rose 2.4% for the 12 months ended in February.
March unfolded as a month marked by geopolitical tensions, inflation anxiety, and a continued shift in investor preferences. The economy remained relatively stable in March, even as the markets reacted sharply to external influences, particularly the escalating conflict involving Iran. Despite a bump at the end of the month after the Iranian president indicated an openness to ending the war, the major indexes closed below their February ending values.
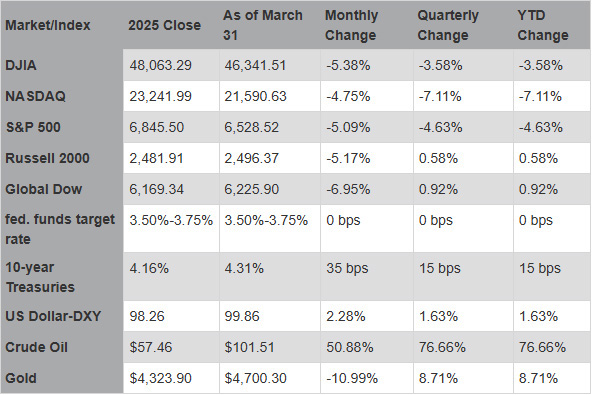
Chart reflects price changes, not total return. Because it does not include dividends or splits, it should not be used to benchmark the performance of specific investments.
Eye on the Quarter Ahead
Economic uncertainty remains elevated heading into the second quarter. The labor market has been underwhelming, inflation remains "sticky," while geopolitical instability continues to be a key variable.
Data sources: Economic: Based on data from U.S. Bureau of Labor Statistics (unemployment, inflation); U.S. Department of Commerce (GDP, corporate profits, retail sales, housing); S&P/Case-Shiller 20-City Composite Index (home prices); Institute for Supply Management (manufacturing/services). Performance: Based on data reported in WSJ Market Data Center (indexes); U.S. Treasury (Treasury yields); U.S. Energy Information Administration/Bloomberg.com Market Data (oil spot price, WTI, Cushing, OK); www.goldprice.org (spot gold/silver); Oanda/FX Street (currency exchange rates). News items are based on reports from multiple commonly available international news sources (i.e., wire services) and are independently verified when necessary with secondary sources such as government agencies, corporate press releases, or trade organizations. All information is based on sources deemed reliable, but no warranty or guarantee is made as to its accuracy or completeness. Neither the information nor any opinion expressed herein constitutes a solicitation for the purchase or sale of any securities, and should not be relied on as financial advice. Forecasts are based on current conditions, subject to change, and may not come to pass. U.S. Treasury securities are guaranteed by the federal government as to the timely payment of principal and interest. The principal value of Treasury securities and other bonds fluctuates with market conditions. Bonds are subject to inflation, interest-rate, and credit risks. As interest rates rise, bond prices typically fall. A bond sold or redeemed prior to maturity may be subject to loss. Past performance is no guarantee of future results. All investing involves risk, including the potential loss of principal, and there can be no guarantee that any investing strategy will be successful.
IMPORTANT DISCLOSURES Camden National Wealth Management does not provide investment, tax, legal, or retirement advice or recommendations. The information presented here is not specific to any individual's personal circumstances. To the extent that this material concerns tax matters, it is not intended or written to be used, and cannot be used, by a taxpayer for the purpose of avoiding penalties that may be imposed by law. Each taxpayer should seek independent advice from a tax professional based on his or her individual circumstances. These materials are provided for general information and educational purposes based upon publicly available information from sources believed to be reliable — we cannot assure the accuracy or completeness of these materials. The information in these materials may change at any time and without notice.
Trust and investment management services are provided by Camden National Bank, a national bank with fiduciary powers. Camden National Bank is a wholly owned subsidiary of Camden National Corporation. Camden National Bank does not provide tax, accounting or legal advice. Please consult your accountant and/or attorney for tax and legal advice.
Investment solutions such as stocks, bonds and mutual funds are:
"NOT A DEPOSIT • NOT FDIC INSURED • NOT GUARANTEED BY THE BANK • NOT INSURED BY ANY FEDERAL GOVERNMENT AGENCY • MAY LOSE VALUE"